API usage
Note
Required role: account_admin
TrustSource records how often each API key is used. Use the statistics to find out which pipeline causes how many calls, and to spot keys nobody uses any more.
Note
The statistics may not include the most recent requests. Expect the latest calls to show up with a delay.
Usage of one key
In Administration → API keys → API keys, each row has a small chart button  . It opens API key usage statistics for that key.
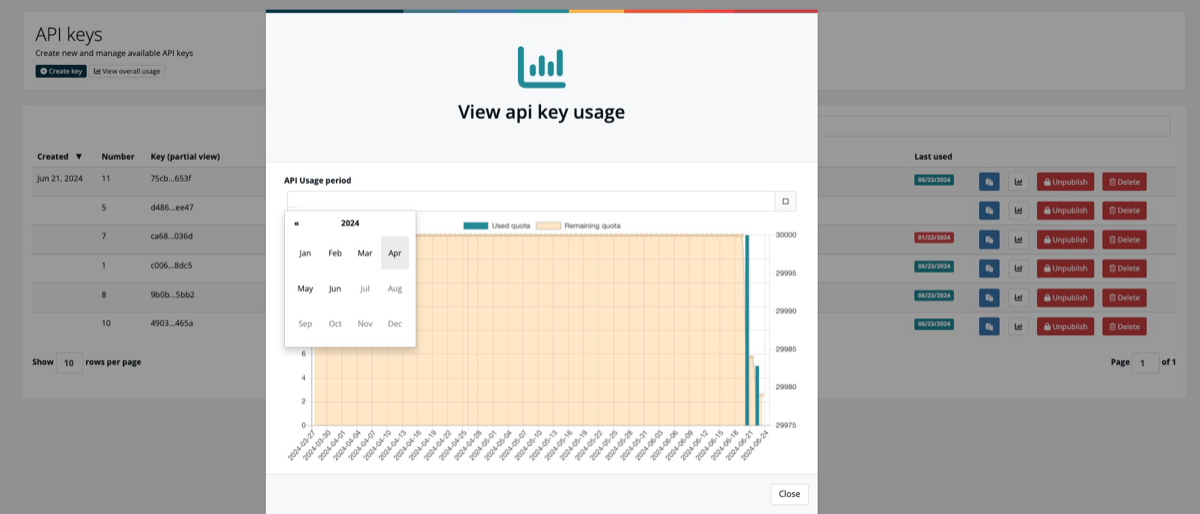
- Choose the API Usage period to switch the month.
- The bars show the Used quota per day.
- The shaded area shows the Remaining quota.
The button stays disabled for keys that are not yet registered for usage tracking.
Usage of all keys
Select View overall usage in the page header. The button appears once your account has a usage plan.
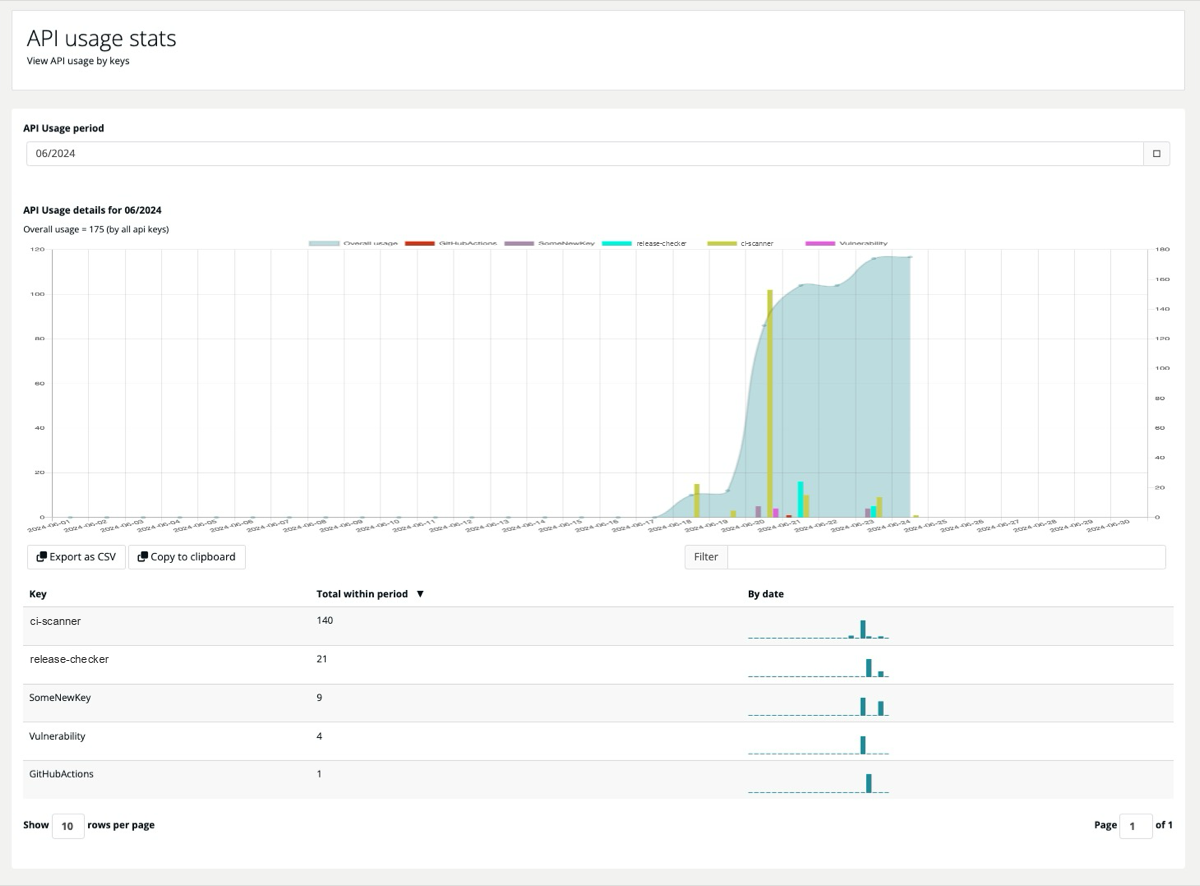
The page API usage stats shows, for the month chosen under API Usage period:
- Overall usage: the total number of calls of all keys in the selected month.
- A chart with the calls per day and key.
- A table with the columns Key, Total within period and By date (a small bar chart per key).
Use the Filter field above the table to find a key by name. Select the column heading to sort.
Export
- Export as CSV downloads a file with one row per key: key name, total within the month and the counts by date. Fields are separated by semicolons.
- Copy to clipboard copies the same data, so you can paste it into a spreadsheet.
Related
- API keys
- REST API: Users -
GET /core/users/usagereturns usage over the API